Interoperation with other tools
Xiaotao Shen (https://www.shenxt.info/)
Created on 2022-05-16 and updated on 2023-10-01
Source:vignettes/interoperability_with_other_tools.Rmd
interoperability_with_other_tools.RmdIntroduction
To make tidyMass and massdataset is more
interoperability with other toolts which have beed developed for omics
data processing and analysis, we provide several functions that could
convert “mass_dataset” and data formats that required by other tools. In
the meanwhile, functions that convert other data formats to
mass_dataset are also provided.
MetDNA
MetDNA is a web-based tool for metabolite annotation
using metabolic reaction network (http://metdna.zhulab.cn/). Users can eaisy convert
mass_dataset to files that required for
MetDNA.
library(massdataset)
library(tidyverse)

data("expression_data")
data("sample_info")
data("sample_info_note")
data("variable_info")
data("variable_info_note")

object =
  create_mass_dataset(
    expression_data = expression_data,
    sample_info = sample_info,
    variable_info = variable_info,
    sample_info_note = sample_info_note,
    variable_info_note = variable_info_note
  )
object
#> --------------------
#> massdataset version: 1.0.12
#> --------------------
#> 1.expression_data:[ 1000 x 8 data.frame]
#> 2.sample_info:[ 8 x 4 data.frame]
#> 3.variable_info:[ 1000 x 3 data.frame]
#> 4.sample_info_note:[ 4 x 2 data.frame]
#> 5.variable_info_note:[ 3 x 2 data.frame]
#> 6.ms2_data:[ 0 variables x 0 MS2 spectra]
#> --------------------
#> Processing information (extract_process_info())
#> 1 processings in total
#> create_mass_dataset ----------
#> Package Function.used Time
#> 1 massdataset create_mass_dataset() 2022-08-07 19:35:20export_mass_dataset4metdna(object = object,
path = "convert/metdna")
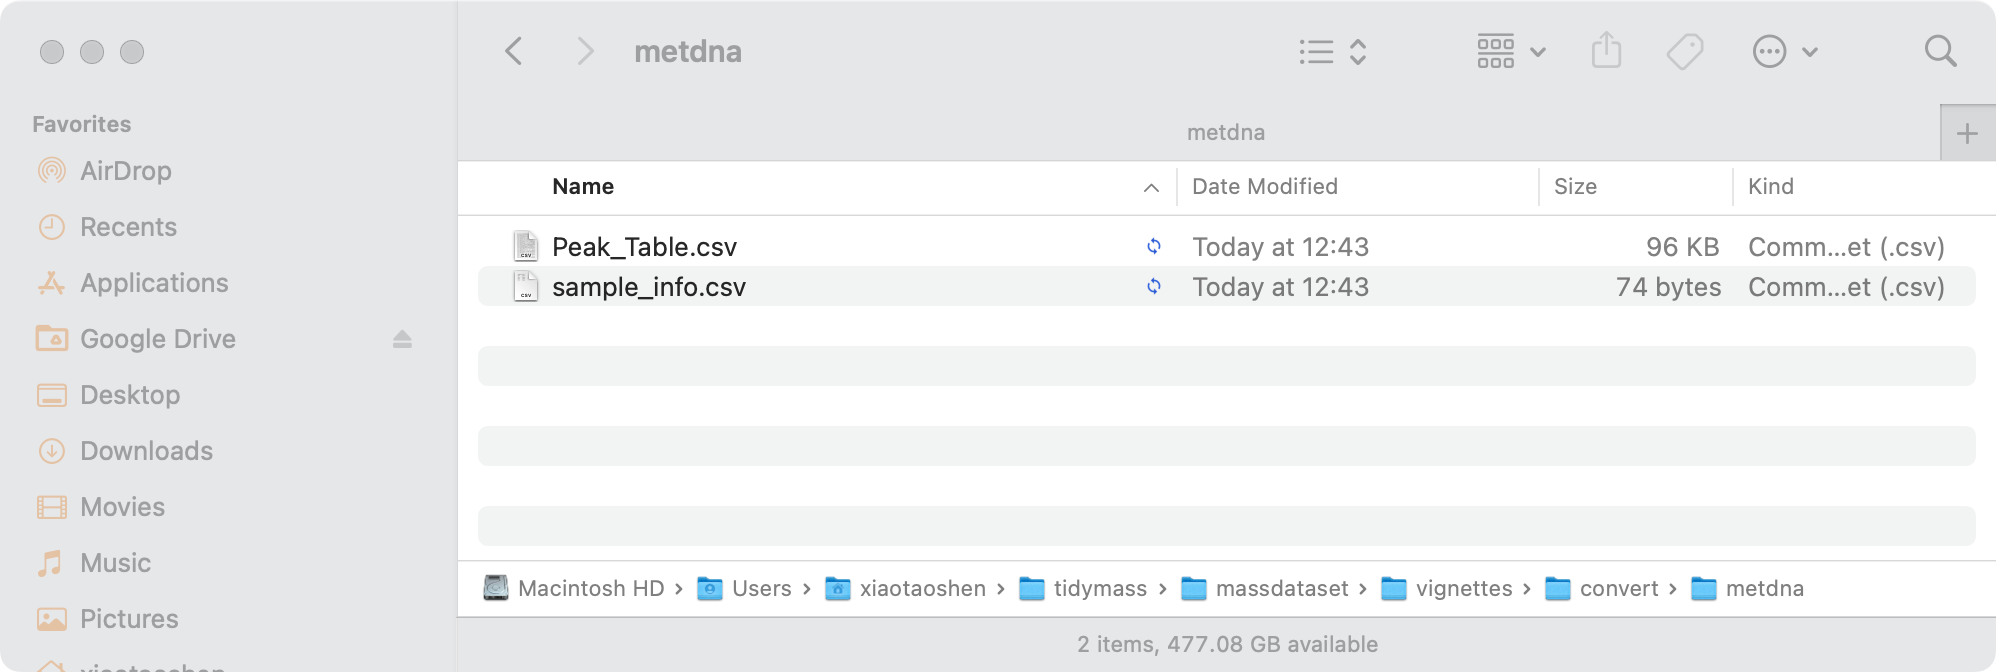
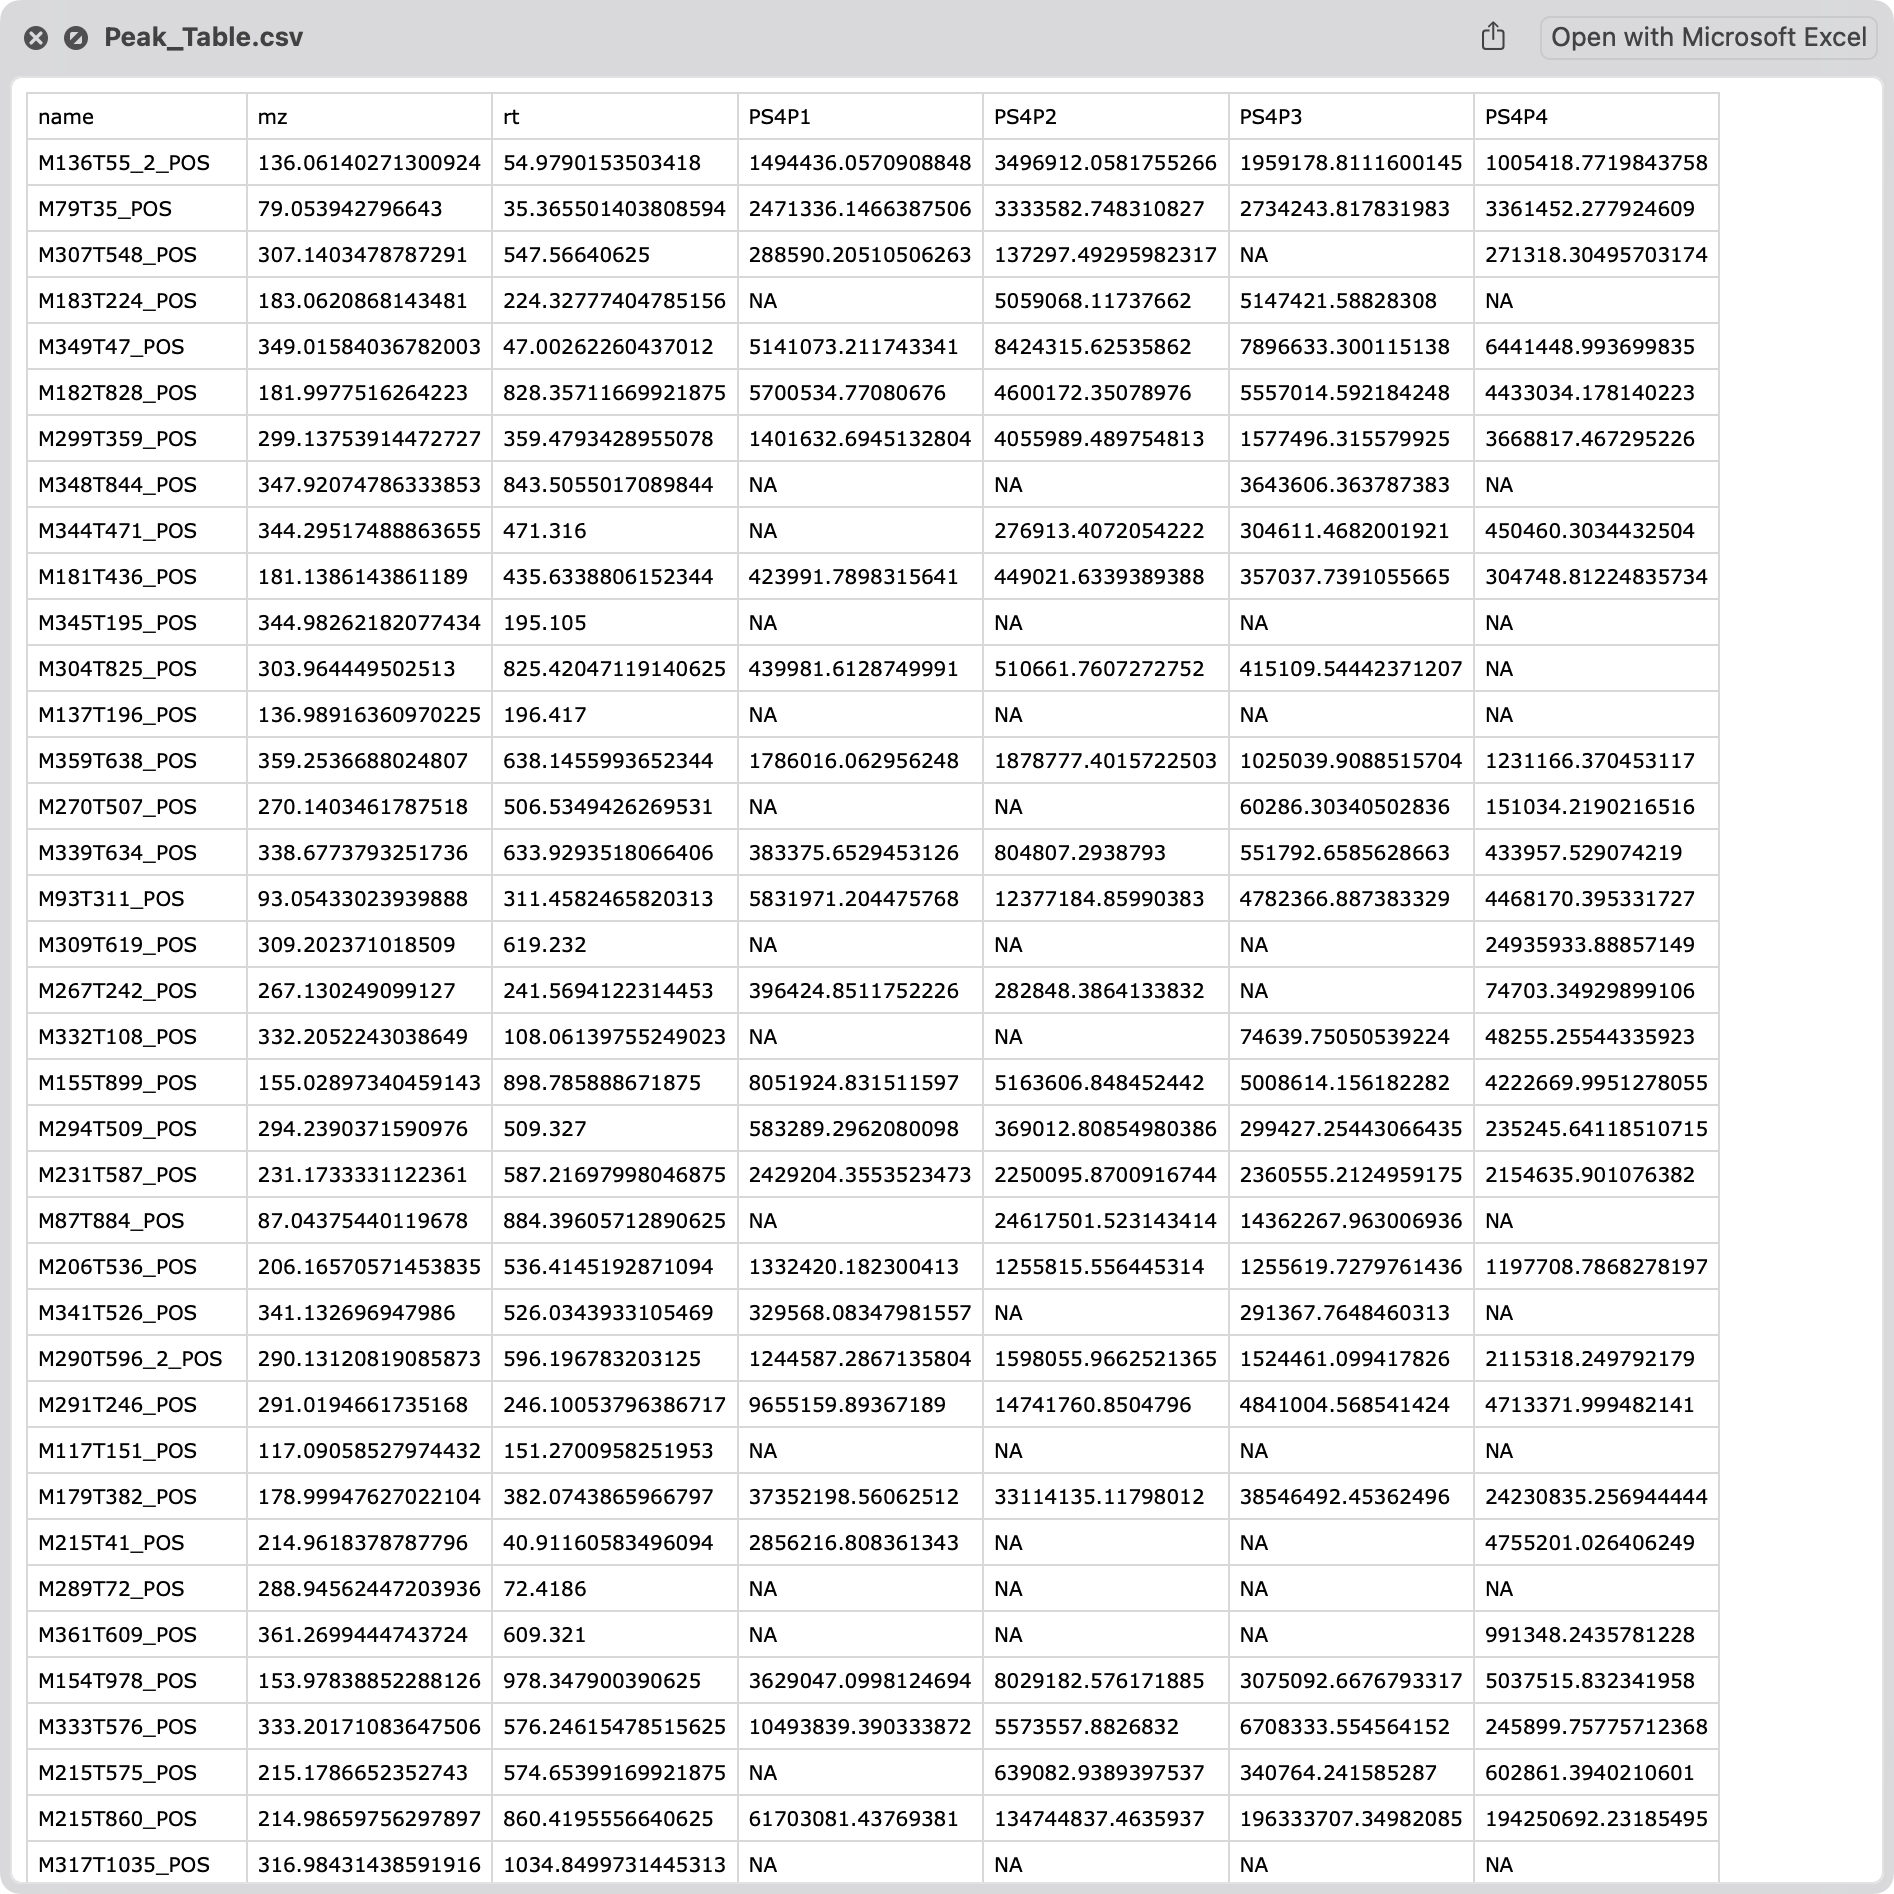
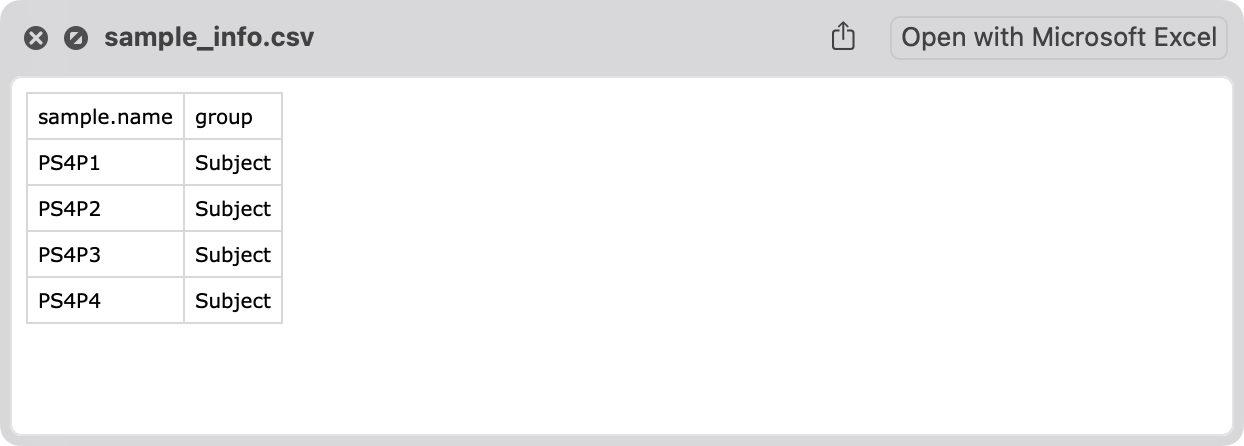
#> NULLThe files will be exported in the folder “convert/metdna”.

Peak table.
 sample_info.

SummarizedExperiment
The SummarizedExperiment class is used to store
rectangular matrices of experimental results, which are commonly
produced by sequencing and microarray experiments. This data structure
is supported by lots of tools in omics files in R environment. We can
use the convert_mass_dataset2summarizedexperiment function
to convert mass_dataset to
SummarizedExperiment class.
Please install SummarizedExperiment first.
if(!require(BiocManager)){
install.packages("BiocManager")
}

if(!require(SummarizedExperiment)){
BiocManager::install("SummarizedExperiment")
}library(SummarizedExperiment)
se_object <-
convert_mass_dataset2summarizedexperiment(object = object)library(SummarizedExperiment)
se_object
#> class: SummarizedExperiment
#> dim: 1000 8
#> metadata(0):
#> assays(1): counts
#> rownames(1000): M136T55_2_POS M79T35_POS ... M232T937_POS M301T277_POS
#> rowData names(3): variable_id mz rt
#> colnames(8): Blank_3 Blank_4 ... PS4P3 PS4P4
#> colData names(4): sample_id injection.order class groupmzTab-m format
mzTab-M is a data standard for sharing quantitative
results in mass spectrometry metabolomics, which is also supported by
lots of tools in metabolomics/proteomics filed (https://pubs.acs.org/doi/10.1021/acs.analchem.8b04310).
In massdataset, we also provide two function to convert
mass_data class and mzTab-m.
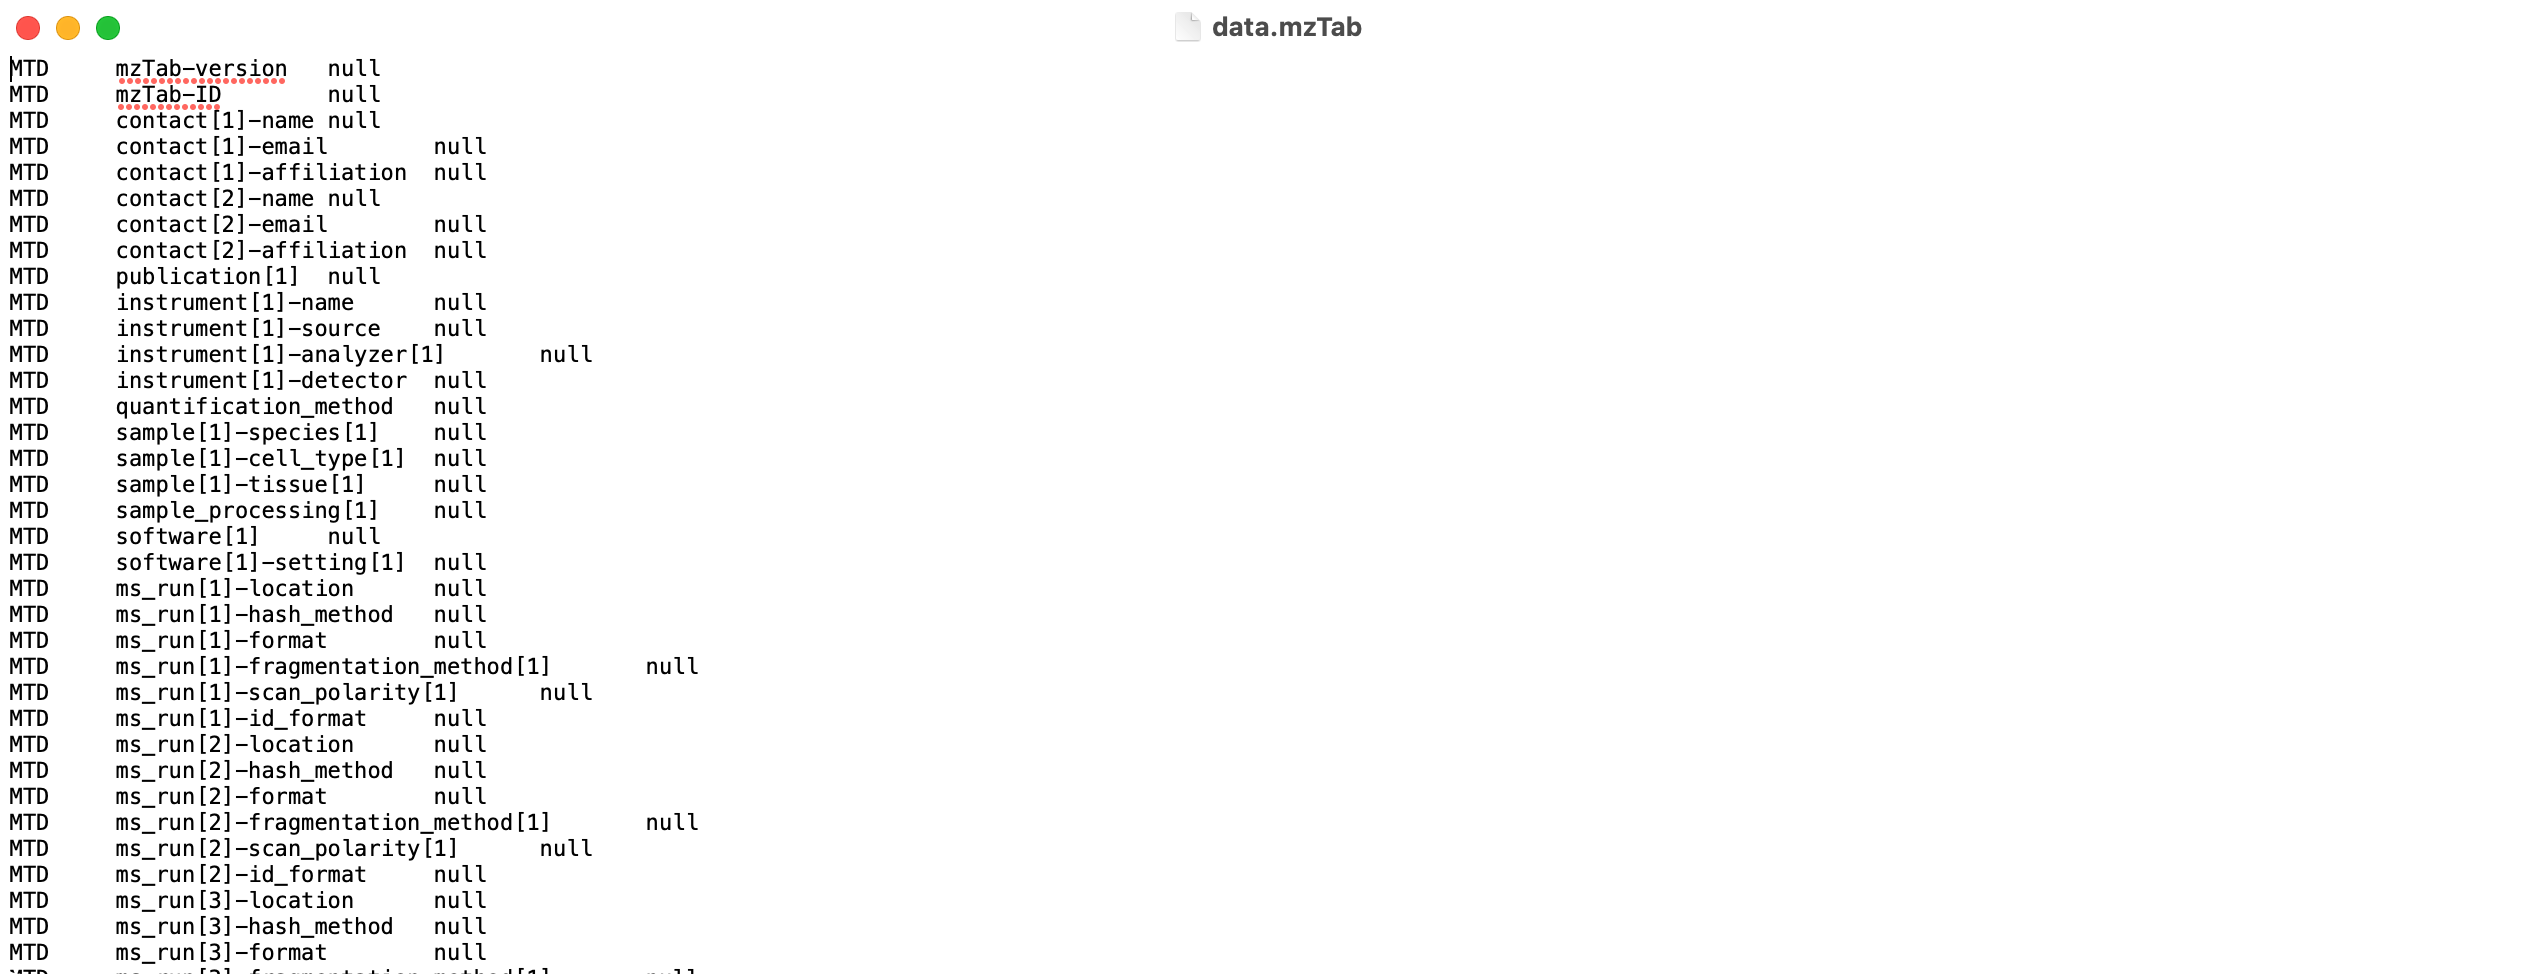
Convert mass_dataset to mzTab-M
convert_mass_dataset2mztab(object = object,
                           path = "convert/mztab")
#> [1] TRUE
The data is put in the folder “convert/mztab”. You can open it with Excel.

RforMassSpectrometry
RforMassSpectrometry is
a project that contains several R software for the analysis and
interpretation of high throughput mass spectrometry assays. We can
eaisly convert mass_dataset to the format that it require
and then analysis using RforMassSpectrometry. Next, we will give an
example how to use the MetaboAnnotation in
RforMassSpectrometry for annotation.
Please install MetaboAnnotation first.
if(!require(BiocManager)){
install.packages("BiocManager")
}

if(!require(MetaboAnnotation)){
BiocManager::install("MetaboAnnotation")
}library(MetaboAnnotation)
library(SummarizedExperiment)Convert mass_dataset class to
SummarizedExperiment class object.
se_object <-
  convert_mass_dataset2summarizedexperiment(object = object)
se_object
#> class: SummarizedExperiment
#> dim: 1000 8
#> metadata(0):
#> assays(1): counts
#> rownames(1000): M136T55_2_POS M79T35_POS ... M232T937_POS M301T277_POS
#> rowData names(3): variable_id mz rt
#> colnames(8): Blank_3 Blank_4 ... PS4P3 PS4P4
#> colData names(4): sample_id injection.order class groupGet the targeted table (database)
target_df <-
  read.table(
    system.file("extdata", "LipidMaps_CompDB.txt",
                package = "MetaboAnnotation"),
    header = TRUE,
    sep = "\t"
  )
head(target_df)
#>   headgroup        name exactmass    formula chain_type
#> 1       NAE  NAE 20:4;O  363.2773  C22H37NO3       even
#> 2       NAT  NAT 20:4;O  427.2392 C22H37NO5S       even
#> 3       NAE NAE 20:3;O2  381.2879  C22H39NO4       even
#> 4       NAE    NAE 20:4  347.2824  C22H37NO2       even
#> 5       NAE    NAE 18:2  323.2824  C20H37NO2       even
#> 6       NAE    NAE 18:3  321.2668  C20H35NO2       even
We need to change the column names to make it fit to
MetaboAnnotation.
rowData(se_object) <-
  extract_variable_info(object) %>%
  dplyr::rename(feature_id = variable_id,
                rtime = rt)
Metabolite annotation.
parm <-
  Mass2MzParam(
    adducts = c("[M+H]+", "[M+Na]+"),
    tolerance = 0.005,
    ppm = 0
  )
matched_features <-
  matchValues(se_object, target_df, param = parm)
matched_features
#> Object of class Matched
#> Total number of matches: 455
#> Number of query objects: 1000 (217 matched)
#> Number of target objects: 57599 (375 matched)matchedData(matched_features)
#> DataFrame with 1238 rows and 11 columns
#> feature_id mz rtime target_headgroup target_name
#> <character> <numeric> <numeric> <character> <character>
#> M136T55_2_POS M136T55_2_... 136.0614 54.9790 NA NA
#> M79T35_POS M79T35_POS 79.0539 35.3655 NA NA
#> M307T548_POS M307T548_P... 307.1403 547.5664 NA NA
#> M183T224_POS M183T224_P... 183.0621 224.3278 NA NA
#> M349T47_POS M349T47_PO... 349.0158 47.0026 NA NA
#> ... ... ... ... ... ...
#> M343T707_2_POS M343T707_2... 343.339 707.297 NA NA
#> M236T543_POS M236T543_P... 236.172 542.567 NA NA
#> M232T937_POS M232T937_P... 231.986 936.608 NA NA
#> M301T277_POS M301T277_P... 301.200 277.116 FA FA 16:2;O3
#> M301T277_POS M301T277_P... 301.200 277.116 MG MG 13:2;O
#> target_exactmass target_formula target_chain_type adduct
#> <numeric> <character> <character> <character>
#> M136T55_2_POS NA NA NA NA
#> M79T35_POS NA NA NA NA
#> M307T548_POS NA NA NA NA
#> M183T224_POS NA NA NA NA
#> M349T47_POS NA NA NA NA
#> ... ... ... ... ...
#> M343T707_2_POS NA NA NA NA
#> M236T543_POS NA NA NA NA
#> M232T937_POS NA NA NA NA
#> M301T277_POS 300.194 C16H28O5 even [M+H]+
#> M301T277_POS 300.194 C16H28O5 odd [M+H]+
#> score ppm_error
#> <numeric> <numeric>
#> M136T55_2_POS NA NA
#> M79T35_POS NA NA
#> M307T548_POS NA NA
#> M183T224_POS NA NA
#> M349T47_POS NA NA
#> ... ... ...
#> M343T707_2_POS NA NA
#> M236T543_POS NA NA
#> M232T937_POS NA NA
#> M301T277_POS -0.000767133 2.54691
#> M301T277_POS -0.000767133 2.54691Session information
sessionInfo()
#> R version 4.2.1 (2022-06-23)
#> Platform: x86_64-apple-darwin17.0 (64-bit)
#> Running under: macOS Big Sur ... 10.16
#>
#> Matrix products: default
#> BLAS:   /Library/Frameworks/R.framework/Versions/4.2/Resources/lib/libRblas.0.dylib
#> LAPACK: /Library/Frameworks/R.framework/Versions/4.2/Resources/lib/libRlapack.dylib
#>
#> locale:
#> [1] en_US.UTF-8/en_US.UTF-8/en_US.UTF-8/C/en_US.UTF-8/en_US.UTF-8
#>
#> attached base packages:
#> [1] stats4    stats     graphics  grDevices utils     datasets  methods
#> [8] base
#>
#> other attached packages:
#>  [1] MetaboAnnotation_1.0.0      SummarizedExperiment_1.26.1
#>  [3] Biobase_2.56.0              GenomicRanges_1.48.0
#>  [5] GenomeInfoDb_1.32.2         IRanges_2.30.0
#>  [7] S4Vectors_0.34.0            BiocGenerics_0.42.0
#>  [9] MatrixGenerics_1.8.1        matrixStats_0.62.0
#> [11] BiocManager_1.30.18         forcats_0.5.1.9000
#> [13] stringr_1.4.0               dplyr_1.0.9
#> [15] purrr_0.3.4                 readr_2.1.2
#> [17] tidyr_1.2.0                 tibble_3.1.7
#> [19] tidyverse_1.3.1             ggplot2_3.3.6
#> [21] magrittr_2.0.3              masstools_1.0.2
#> [23] massdataset_1.0.12
#>
#> loaded via a namespace (and not attached):
#>   [1] readxl_1.4.0                backports_1.4.1
#>   [3] circlize_0.4.15             systemfonts_1.0.4
#>   [5] igraph_1.3.2                plyr_1.8.7
#>   [7] lazyeval_0.2.2              BiocParallel_1.30.3
#>   [9] Rdisop_1.56.0               digest_0.6.29
#>  [11] foreach_1.5.2               yulab.utils_0.0.5
#>  [13] htmltools_0.5.2             fansi_1.0.3
#>  [15] memoise_2.0.1               cluster_2.1.3
#>  [17] doParallel_1.0.17           tzdb_0.3.0
#>  [19] openxlsx_4.2.5              limma_3.52.2
#>  [21] ComplexHeatmap_2.12.0       modelr_0.1.8
#>  [23] vroom_1.5.7                 pkgdown_2.0.5
#>  [25] colorspace_2.0-3            rvest_1.0.2
#>  [27] textshaping_0.3.6           haven_2.5.0
#>  [29] xfun_0.31                   crayon_1.5.1
#>  [31] RCurl_1.98-1.7              jsonlite_1.8.0
#>  [33] impute_1.70.0               iterators_1.0.14
#>  [35] glue_1.6.2                  gtable_0.3.0
#>  [37] zlibbioc_1.42.0             XVector_0.36.0
#>  [39] GetoptLong_1.0.5            DelayedArray_0.22.0
#>  [41] shape_1.4.6                 MetaboCoreUtils_1.4.0
#>  [43] scales_1.2.0                vsn_3.64.0
#>  [45] DBI_1.1.3                   Rcpp_1.0.8.3
#>  [47] mzR_2.30.0                  viridisLite_0.4.0
#>  [49] clue_0.3-61                 gridGraphics_0.5-1
#>  [51] bit_4.0.4                   preprocessCore_1.58.0
#>  [53] MsCoreUtils_1.8.0           htmlwidgets_1.5.4
#>  [55] httr_1.4.3                  RColorBrewer_1.1-3
#>  [57] ellipsis_0.3.2              pkgconfig_2.0.3
#>  [59] XML_3.99-0.10               sass_0.4.1
#>  [61] dbplyr_2.2.1                utf8_1.2.2
#>  [63] ggplotify_0.1.0             tidyselect_1.1.2
#>  [65] rlang_1.0.3                 munsell_0.5.0
#>  [67] cellranger_1.1.0            tools_4.2.1
#>  [69] cachem_1.0.6                cli_3.3.0
#>  [71] QFeatures_1.6.0             generics_0.1.3
#>  [73] broom_1.0.0                 evaluate_0.15
#>  [75] fastmap_1.1.0               mzID_1.34.0
#>  [77] yaml_2.3.5                  ragg_1.2.2
#>  [79] bit64_4.0.5                 knitr_1.39
#>  [81] fs_1.5.2                    zip_2.2.0
#>  [83] AnnotationFilter_1.20.0     ncdf4_1.19
#>  [85] pbapply_1.5-0               xml2_1.3.3
#>  [87] compiler_4.2.1              rstudioapi_0.13
#>  [89] plotly_4.10.0               png_0.1-7
#>  [91] affyio_1.66.0               reprex_2.0.1
#>  [93] bslib_0.3.1                 stringi_1.7.6
#>  [95] desc_1.4.1                  MSnbase_2.22.0
#>  [97] lattice_0.20-45             ProtGenerics_1.28.0
#>  [99] Matrix_1.4-1                ggsci_2.9
#> [101] vctrs_0.4.1                 pillar_1.7.0
#> [103] lifecycle_1.0.1             jquerylib_0.1.4
#> [105] MALDIquant_1.21             GlobalOptions_0.1.2
#> [107] data.table_1.14.2           bitops_1.0-7
#> [109] R6_2.5.1                    pcaMethods_1.88.0
#> [111] affy_1.74.0                 codetools_0.2-18
#> [113] MASS_7.3-57                 assertthat_0.2.1
#> [115] rprojroot_2.0.3             rjson_0.2.21
#> [117] withr_2.5.0                 GenomeInfoDbData_1.2.8
#> [119] MultiAssayExperiment_1.22.0 parallel_4.2.1
#> [121] hms_1.1.1                   grid_4.2.1
#> [123] rmarkdown_2.14              Spectra_1.6.0
#> [125] lubridate_1.8.0