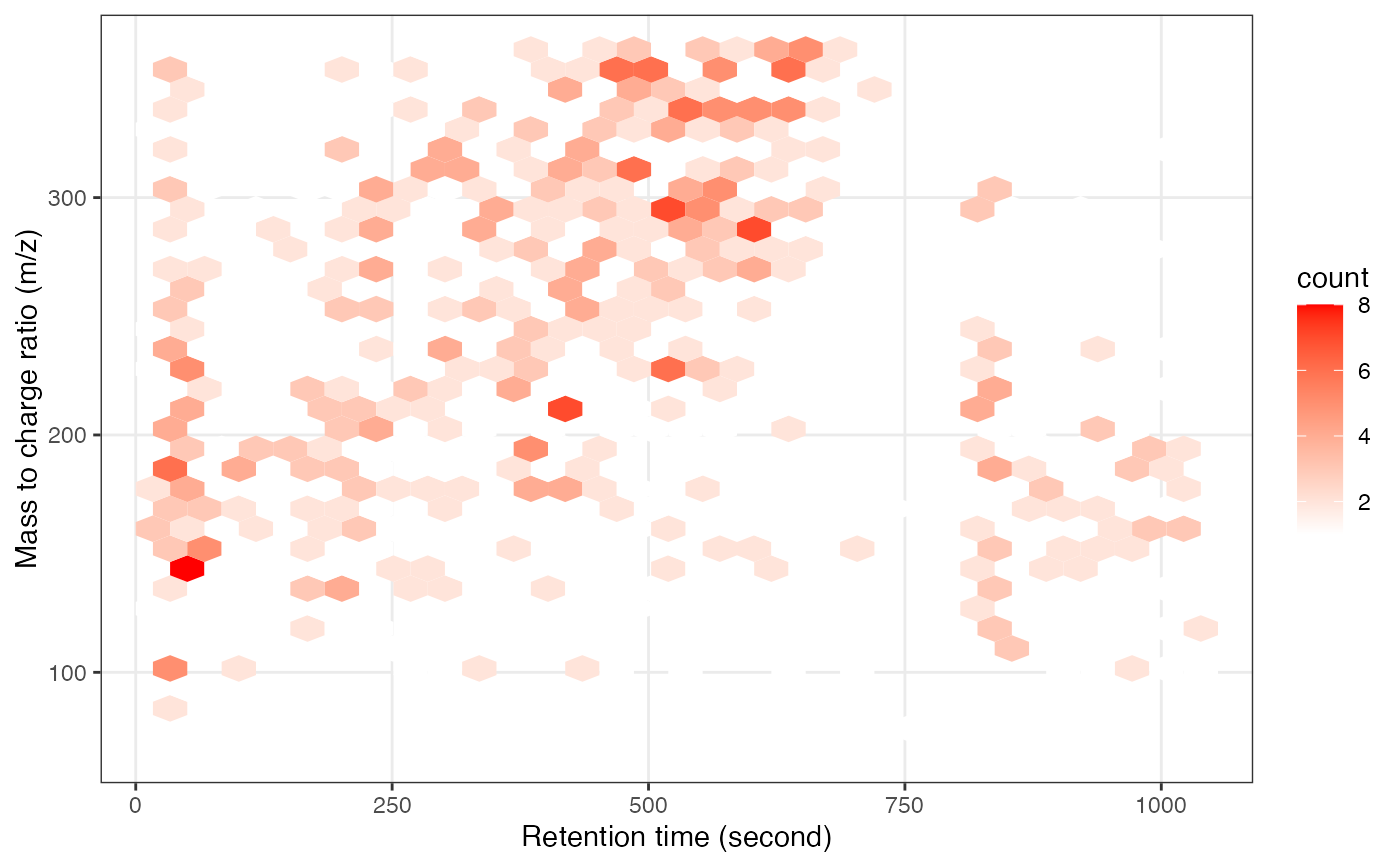
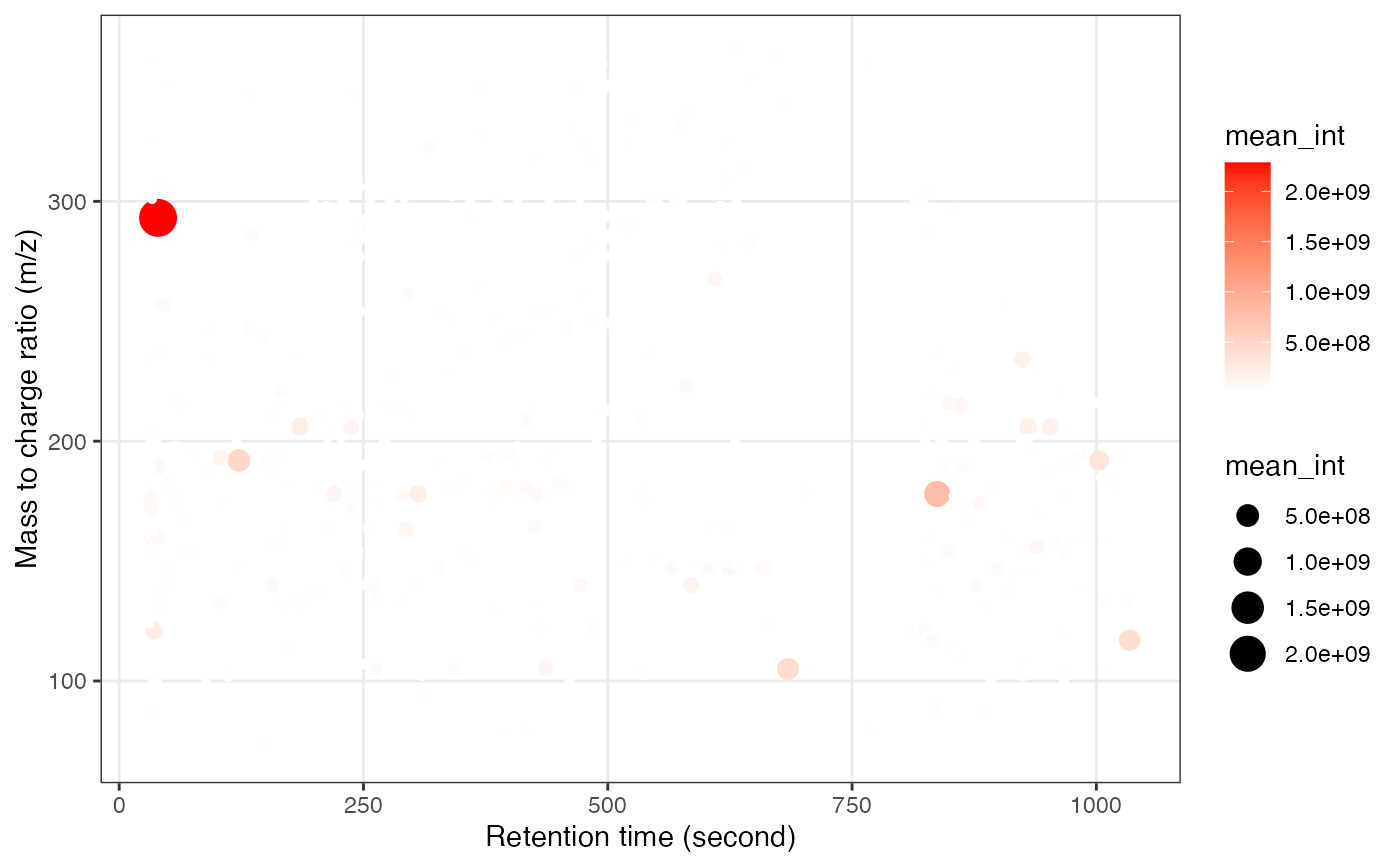
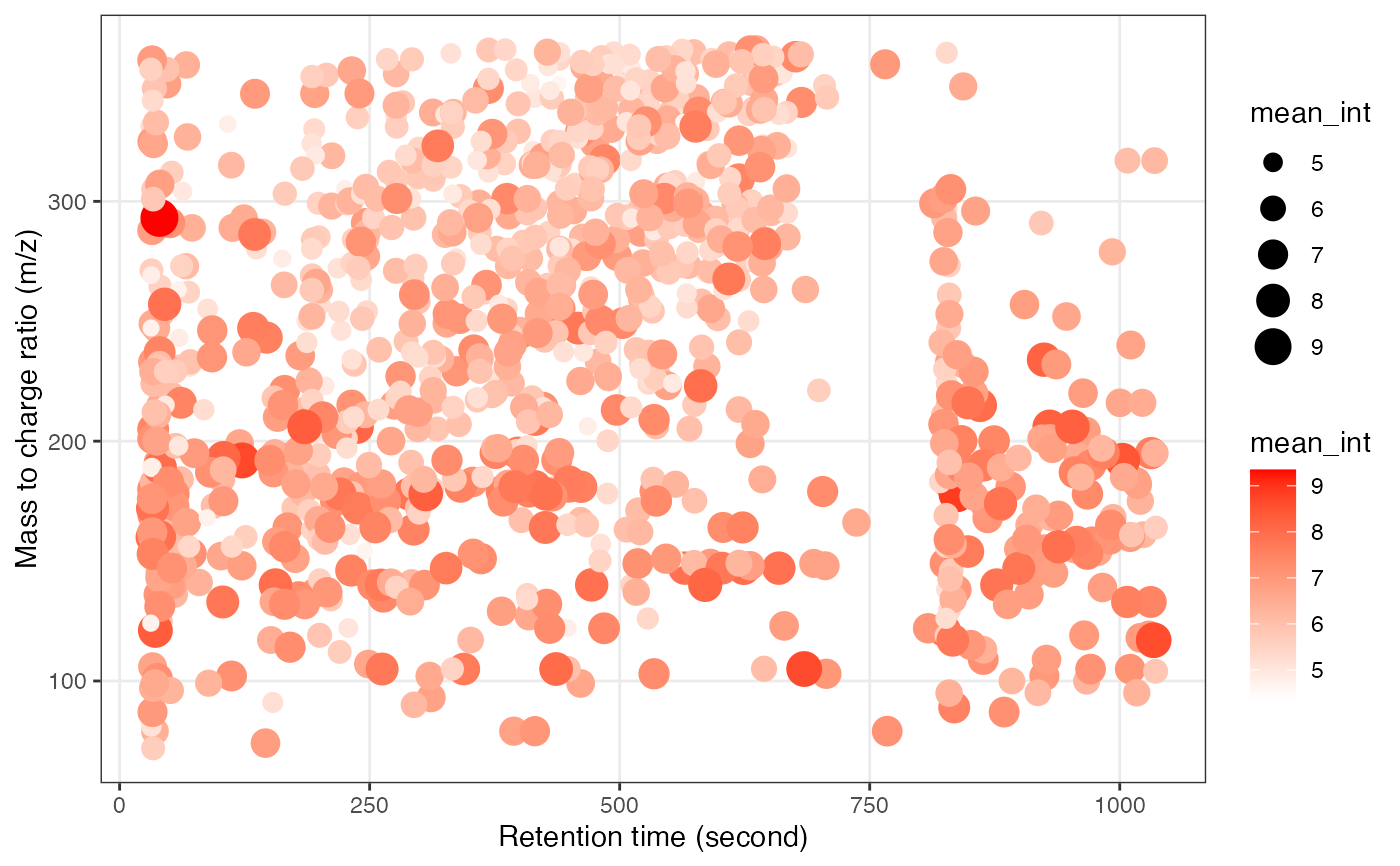
This function generates a plot of mass-to-charge ratio (m/z) against retention time (rt) for a mass_dataset object. The plot can be either a hexbin plot or a scatter plot based on the hex parameter.
show_mz_rt_plot(object, hex = FALSE)Arguments
- object
A
mass_datasetobject for which the mz-rt plot is to be generated.- hex
Logical. If TRUE, a hexbin plot is generated; otherwise, a scatter plot is generated. Default is FALSE.
Value
A ggplot object representing the mz-rt plot.
Examples
data("expression_data")
data("sample_info")
data("variable_info")

object =
  create_mass_dataset(
    expression_data = expression_data,
    sample_info = sample_info,
    variable_info = variable_info,
  )

  show_mz_rt_plot(object)

  show_mz_rt_plot(log(object, 10))


  show_mz_rt_plot(object, hex = TRUE)